Introduction
For a company that wants to increase sales, it is far more critical to keep existing customers than to find new ones. There are two reasons for it: 1) it is far cheaper to keep customers than to look for new ones, 2) in most cases, customers with a prior order history have a lower barrier to ordering again than those who have never ordered on the platform before.
Add to that the additional metrics the company prioritizes, like the sustainability of the products being purchased by the consumers. The problem now gets even more convoluted. So Imagine you are the head of a company that wants to increase sales and wants its customers to order more sustainable products while doing that. For my Insight project, I consulted for a company that faced this very problem. The company cares deeply about the sustainability of the products they sell. Without readjusting their focus on it, they also want, like any other company, to increase sales and grow their profits.
Exploring the data
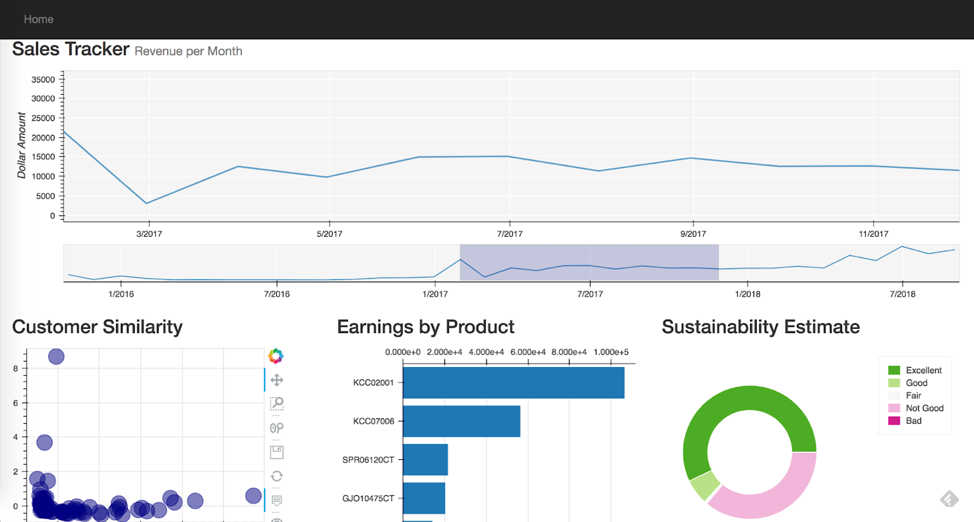
The company had accumulated a lot of data over time. The data contained everything from the order history of consumers to metadata for those orders, the products themselves, and their manufacturers. This amounted to a lot of data distributed over 50 different tables interconnect with foreign keys and their respective primary key. The company’s vision for achieving their goals was to build out a ‘sustainability dashboard’ to provide company-wide, and customer specific, metrics about the sales/expenditure and the associated environmental goals. This would then be used to send out weekly/monthly updates to the consumers to encourage spending on more environmentally friendly products.
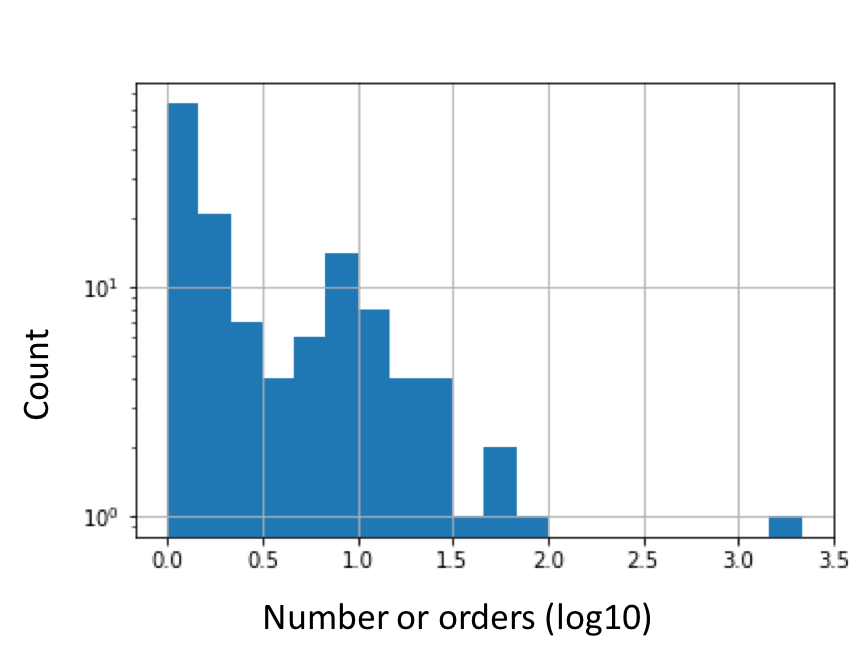
Building a histogram of the company-wide order histories made one thing clear. The company faced a challenge that most other companies face today in our modern online-ordering market that is inundated with options. It can be visualized from this figure below. It is quite evident that some customers order a lot of products, which drives up sales figures. However, the company is missing out on a lot of potential orders from customers who order only a few times but do not return to order again.
While brainstorming with the company to flesh-out the dashboard, I realized that a great value-addition to it would be a recommendation engine. All the historical data of past purchases by a consumer could be used to make customer-specific recommendations of products that they may like, but did not know existed in the catalog. This recommendation engine could serve two purposes at the same time; introduce consumers to new products they might need, and nudge them towards greener products.
Implementing the dashboard
Data from all the different tables was wrangled in python. Specifically, pandas, the python data analysis library, and numpy were extensively used to clean and pre-process the data. Sustainability estimates were generated by feature engineering to combine recycled content and the carbon footprint of each item. Pandas functions such as join, merge and other aggregating functions like groupby had to be abundantly deployed to get the required metrics.
I chose to use Bokeh to visualize these metrics. Bokeh appeared very promising for this task since it is open-source. It offers an ‘interactive visualization library that targets modern web browsers for presentation. Its goal is to provide elegant, concise construction of basic exploratory and advanced custom graphics in the style of D3.js’. To serve these visualizations in the form of an interactive, customizable, and robust web app I decided to integrate it with Flask. Flask is a ‘micro web framework written in Python and is based on Werkzeug, Jinja 2 and good intentions’.
Implementing the recommender system
There are several possible methods to implement a recommender system. Every method offers certain advantages and disadvantages. I wanted a method that can be pushed into production rapidly in a scalable manner. I opted for the k-nearest-neighbor (KNN) method. KNN belongs to a sub-category of recommender systems called as ‘collaborative filtering’. Collaborative filtering matches users that like the same items. ‘Liking’ a product can be inferred implicitly by looking at a consumer’s purchase history. This then gives a large user-item matrix, where each row is a customer and each column is all the products that a user can purchase. This user-item matrix can then be filled with 1 if the corresponding item was purchased by its corresponding user, or 0 if it was not. Since a customer can potentially order a lot of products, this user-item matrix was very wide (many more columns than rows). Also, since a consumer only orders a small subset of these thousands of products on offer, this matrix is pretty sparse (has lots of zeros in it). Therefore, reducing the dimensions of this matrix was essential to help KNN find the optimal solution. I used scikit learn to perform principal component analysis (PCA) which reduced the dimensions of the data without much loss of its variation. I then used KNN to find the nearest-neighbors of each consumer in this reduced two-dimensional (first two principal components) space. To make a recommendation, I simply went down the list of most-ordered items by the closest neighbor until I found one that had not been ordered by the original consumer before.
This gives a good recommendation that is personalized to the customer. But, how do we account for other metrics like sustainability, which are highly prioritized by the company? To factor it in, I first calculated the weighted overall sustainability of all products of the customer. I then made only those recommendations which are at least a little greener than this previous average. This serves our two purposes. First, it introduces a customer to a personalized product they might like but were probably not aware it existed in the catalog. Additionally, it nudges them towards a greener product.
In the end, the company received a dashboard with customer-specific metrics. Additionally, the dashboard contained a personalized and environmentally conscious recommendation for each customer that would help improve sales while helping our planet.
Overall, it was a very valuable experience for me. It exposed me to real-world data, working with a real company to implement a practical and environmentally friendly solution.